Steve Bee – VPS Group Marketing & Strategic Projects Director
Introduction
2025 saw another challenging year for global marine fuel quality, as decarbonization legislation took numerous twists and turns, increasing demands upon ship owners and operators across the world. Alongside this, the traditional fossil fuels also raised numerous quality issues.
The IMO delayed the vote on the adoption of the Net Zero Framework (NZF) for one year after strong lobbying against the measures, especially from the USA and Saudi Arabia. This has made the next steps for shipping emissions regulation uncertain with re-negotiation now needed in order to overcome the now apparent entrenched split between countries’ positions.
However, other areas of decarbonization regulation continue to progress, with a review of CII ratings ongoing at the IMO and annual reduction factors to 2030 agreed upon, but still much to be discussed in the upcoming phase 2. The Mediterranean ECA entered into force in May-25, while the Canadian Arctic, Norwegian Sea and NE Atlantic ECAs are approaching. Meanwhile, EU emissions regulation sees the phase-in of the EU ETS continuing, with a further step-up due in Jan-26, while FuelEU Maritime entered into force in Jan-25, with standards scheduled to tighten over the coming years.
The uptake of alternative fuels continued to rise, with alternative fuel capable vessels accounting for over half of orderbook in investment terms. Its estimated by 2030 nearly 20% of the fleet is set to be alternative fuel capable.
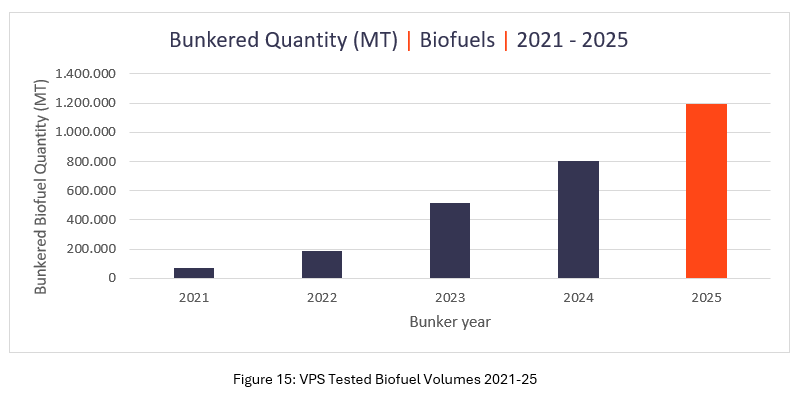
VPS tested 1.2million mt of biofuels delivered to ships in 2025, a 50% increase on 2024 levels. Plus methanol testing and ethanol testing demand also increased.
The delay to the IMO NZF vote extends regulatory uncertainty for shipping and could have some bearing on fueling choices in the short-term, with a lack of a clear signal needed to drive more significant investment in ‘green’ technologies.
However, 'green' fleet renewal remains a key factor supporting new-build appetite in some sectors (notably containers) and is expected to remain a general underlying theme, driving investment decisions against the backdrop of an ageing fleet and industry efforts to reduce emissions.
Flexibility and optionality are current key themes, with continuing progress in the uptake of scrubbers (fitted on 30% of fleet GT), ‘Eco’ engines (36%) and Energy Saving Technologies (44%).
From a fossil fuel perspective, VPS issued 37 bunker alerts over 2025, an increase of 37% over 2024, with VLSFOs being the fuel type requiring the highest number of alerts and Singapore being the most frequent port/region providing potentially problematic fuels. VPS witnessed a pandemic of high cat-fine levels in VLSFOs during August, resulting in seven bunker alerts being released for cat-fine levels ranging from 62ppm-176ppm across East Coast USA, Singapore, Algeciras ARA and Port Louis. This issue highlighted the importance of employing fuel system check services to provide elevated protection and risk mitigation for vessels. In addition VPS witnessed numerous flash point issues, which were in the main related to distillate fuels, but also VLSFOs and HSFOs suffered from this problem.
In addition, VPS identified, via our new advanced chemical screening service, the contamination of residual-based fossil fuels, by cashew nut shell liquid (CNSL). This non-volatile organic compound, if undetected pre-burn, can cause issues with fuel pumps and exhaust systems and SCR units.
The 2025 Marine Fuel Mix
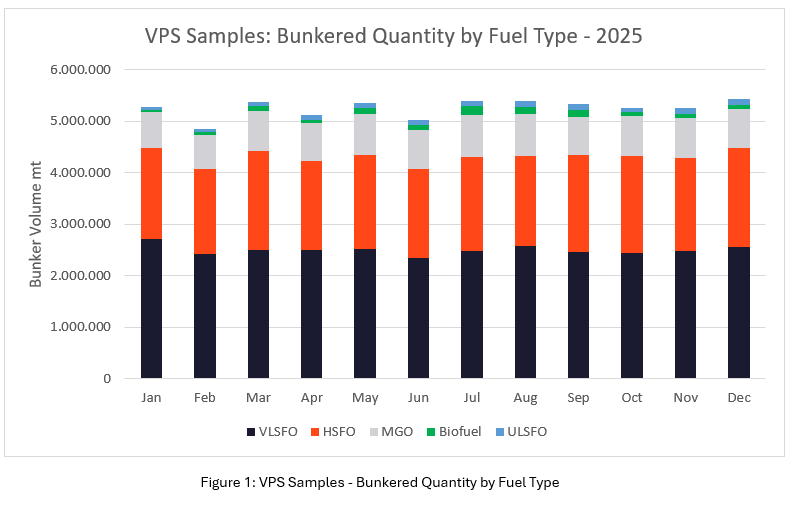
Across 2025, the fuel mix with respect to samples received for testing in VPS laboratories, equated to more than 63 million MT, which averages at 5.25 million MT of marine fuels per month. VLSFO was the most popular marine fuel with 47.6% of the fuels used, followed by 34.4% HSFO, 14.4% MGO, 1.9% Biofuels and 1.8% ULSFO. Regarding biofuels usage, the samples tested by VPS equated to an increase from 805,808 MT in 2024 to 1,203,760MT in 2025 (+50%).
Testing to ISO8217
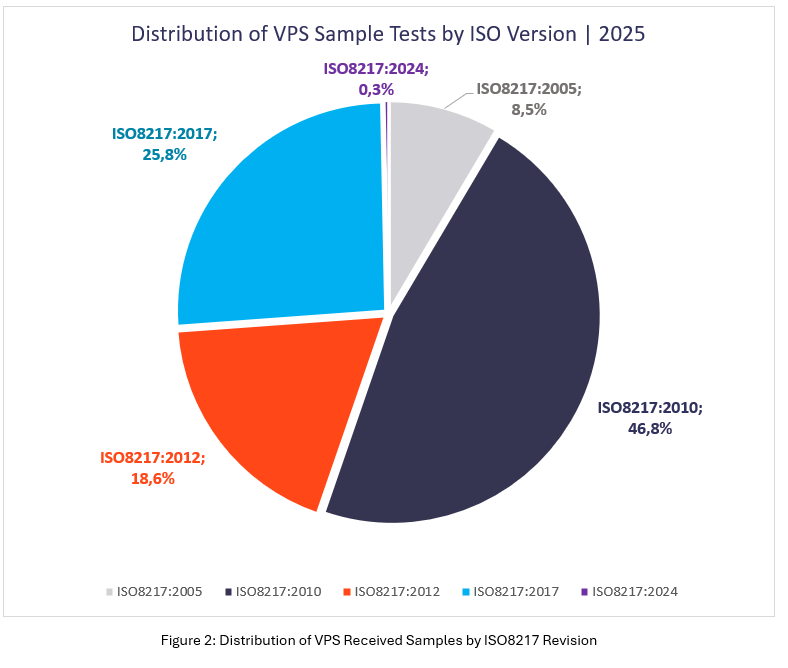
Despite the introduction of the latest and seventh revision of the International Marine Fuel Quality Standard, ISO8217 in May 2024, VPS has seen little take-up of fuel being purchased against this latest revision, at around 0.3% of samples received. In fact, those samples we have received purchased against the latest standard have been for biofuels only.
It is surprising that just over 8% of samples received by VPS for testing in 2025, are still being purchased against ISO8217:2005. This revision is over 20 years old and bears little resemblance to today’s fuel. Therefore, vessels purchasing fuel to this standard are at greater risk of damages and environmental non-compliance.
The majority of marine fuel is still being purchased to ISO8217:2010/12 revisions, (65.4%), which are themselves around 15 years old and offering reduced protection for vessels versus the latest revision. Even the 8 year old 2017 specification, which offers no specification for 0.50%-sulphur fuels, or 0.10%-sulphur fuels, accounts for only 26% of the fuels received for testing.
VPS Bunker Alerts
Bunker Alerts highlight short term quality fuel quality issues identified by VPS, for a specific test parameter of a specific fuel grade/type in a specific port. The service provides valuable information to customers, to assist in avoiding potentially problematic fuel types in a highlighted port or region, to further protect the customer’s asset and crew.
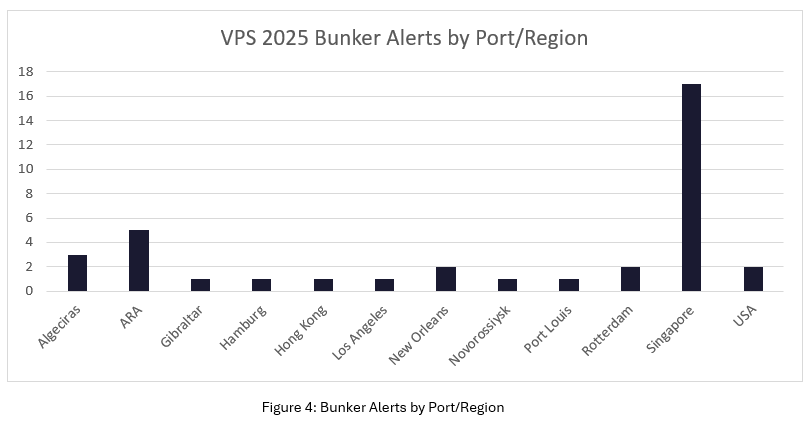
Across 2025, VPS issued 37 bunker alerts, compared to only 27 alerts in 2024, an increase of 37%.
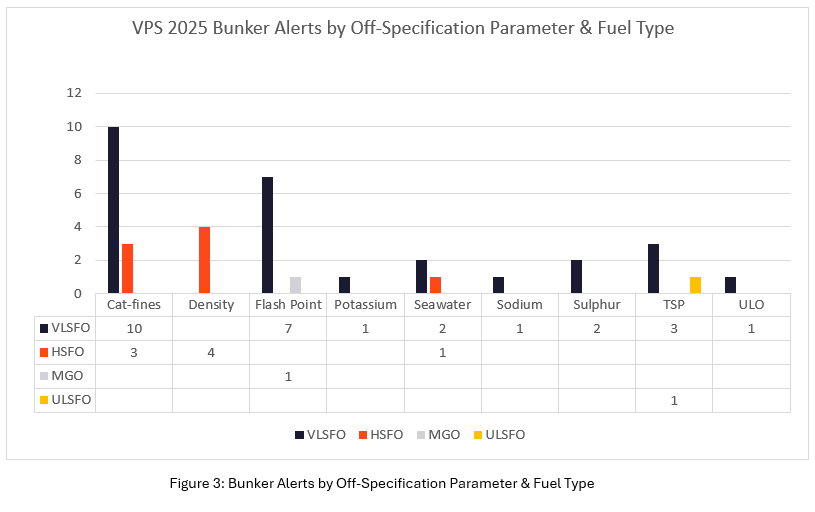
The 2025 Bunker Alerts included all the marine fossil fuel grades of VLSFO (27), being the most problematic fuel, followed by HSFO (8), MGO (1) and ULSFO (1).
The Bunker Alerts covered 9 different test parameters, Cat-fines (13), Flash Point (8), TSP (4), Density (4), Seawater (3), Sulphur (2), Sodium, Potassium, ULO.
Singapore accounted for 46% of the Bunker Alerts issued in 2025, which is an unusually high level. Whilst China did not require any Bunker Alerts during the course of the year.
2025 Marine Fuel Off-Specifications
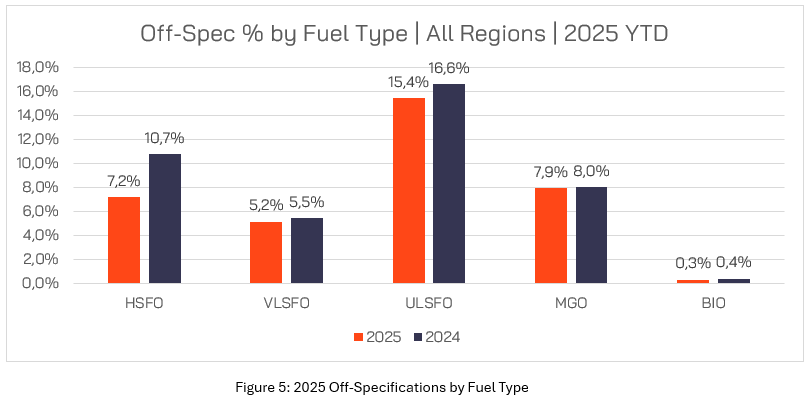
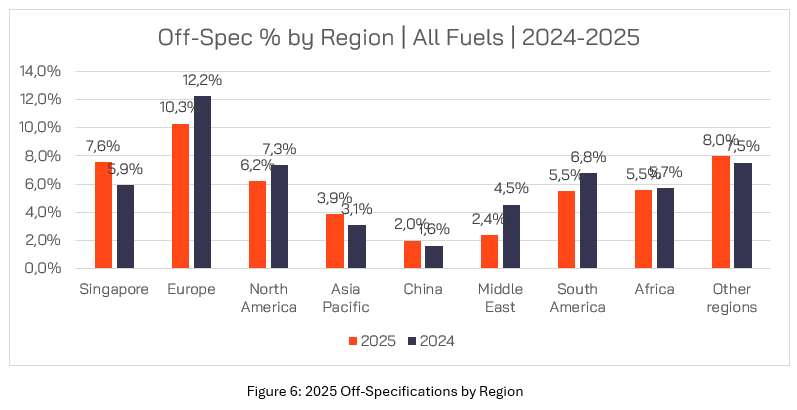
Whilst VPS issued 37% more Bunker Alerts in 2025 versus 2024, the overall off-specifications by fuel grade actually improved against 2024 levels for HSFOs, VLSFOs, ULSFOs, MGO and Biofuels. The greatest improvement was shown by HSFOs going from 10.7% in 2024 to 7.2% in 2025.
In terms of region, Europe continues to be the area providing the highest level of off-specification fuel, even though the level of off-specs improved in 2025 versus 2024, going from 12.2% to 10.3%. However, Singapore’s off-specification rate increased from 5.9% in 2024 to 7.6% in 2025.
VLSFO Fuel Quality
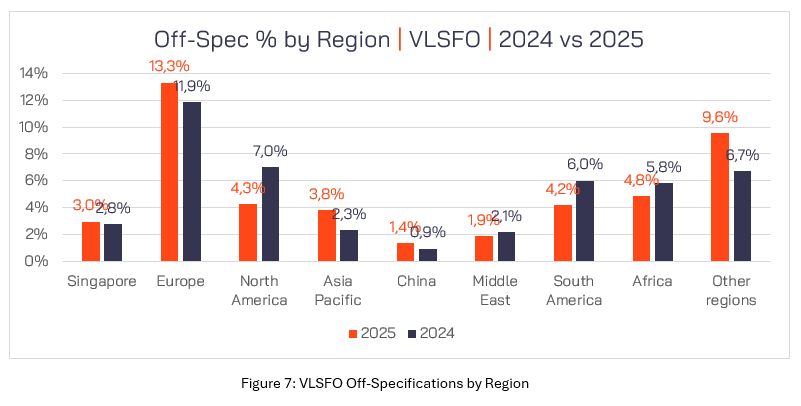
As the most used marine fuel type, VLSFO accounts for almost half of the fuels tested by VPS. In terms of quality, VLSFO had an off-specification rate of 5.2% in 2025. Of the 5.2% VLSFO off-specifications, Europe provided the highest level of off-specification VLSFOs in both 2025 (13.3%) and 2024 (11.9%). Africa, as a specific region, provided the next highest level of off-specification VLSFO with 4.8% of fuels tested exhibiting at least one off-specification parameter in 2025 compared to 5.8% in 2024. North America had the third highest VLSFO off-specification rate with 4.3% off-specs versus 7% in 2024.
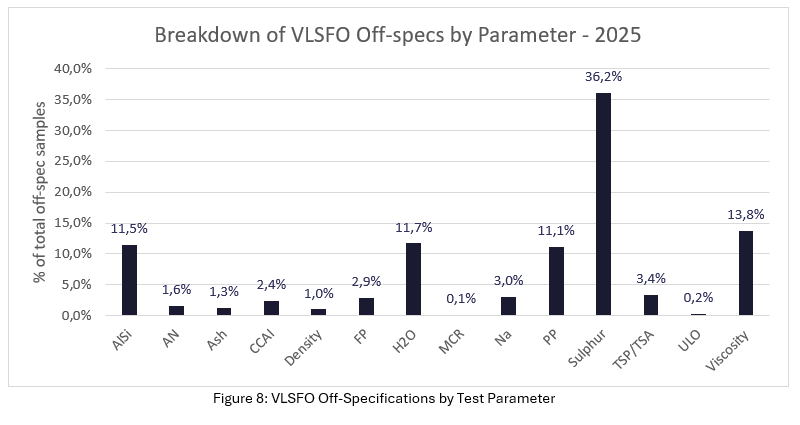
Sulphur is the most common off-specification parameter of VLSFOs, accounting for 36.2% of VLSFO off-specs in 2025. When it comes to looking at all VLSFOs tested, 0.5% had a sulphur content >0.53%, whilst 1.4% of samples tested were between 0.50%-0.53% sulphur and the remaining 98.1% had a sulphur content of <0.50%. 11.5% of VLSFOs had off-specification cat-fines. During August 2025, VPS witnessed a pandemic of high cat-fines in VLSFOs, warranting seven bunker alerts to issued in a single month, a scenario never witnessed before.
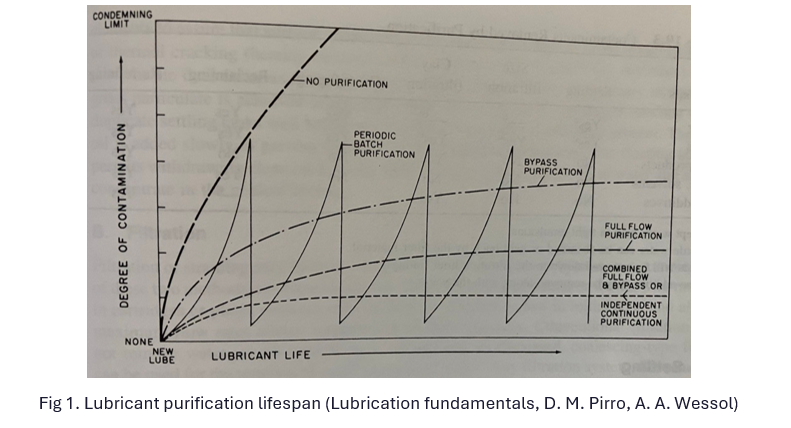
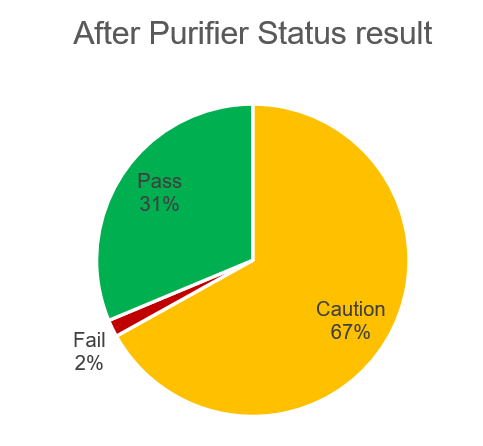
There was no link between these fuels which were supplied across East Coast USA, ARA, Algeciras, Port Louis and Singapore, by different suppliers. Such an event highlights the importance of the need to carryout regular quarterly Fuel System Checks (FSCs) in order to monitor the efficiency of the vessel’s purifiers. Using this service helps verify purifier efficiency, which typically achieves 60–80% removal of cat-fines when operated correctly; however, given that many OEMs recommend cat-fine levels below 15 ppm, elevated delivery levels (with 21.5% of VLSFOs exceeding 40 ppm, despite remaining within the ISO 8217 limit of 60 ppm) can still pose a significant wear risk if purification performance is not optimal.
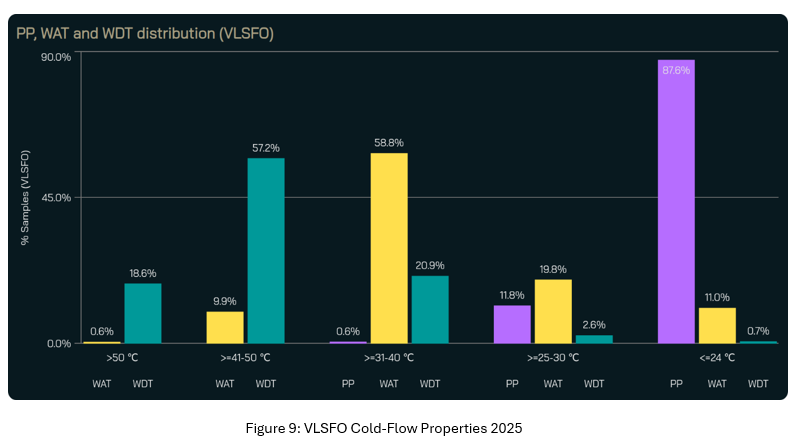
The importance of the additional cold-flow test of Wax Appearance Temperature (WAT) and Wax Disappearance Temperature (WDT), was further highlighted in 2025 with 59% of VLSFOs exhibiting WAT of 31-40ºC and 10% having WAT between 41-50ºC. 57% of VLSFO samples had a WDT of 41-50ºC, with 19% having a WDT of >50ºC. VLSFOs cold-flow properties are a definite concern with wax precipitating from the fuel at temperatures way in excess of 10ºC above the pour point, potentially causing numerous operational problems such as filter and pipework blockages.
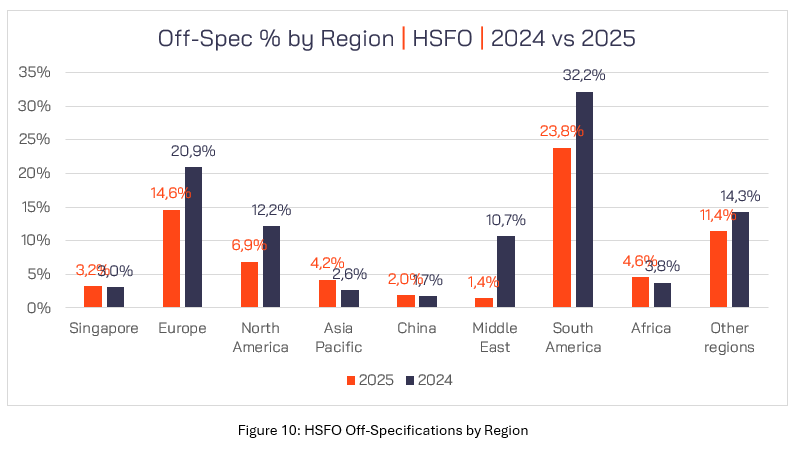
HSFO Fuel Quality
HSFO represents almost 34.4% of all bunker samples received by VPS for testing, indicating a relatively high level of scrubber usage onboard vessels today. 7.2% of HSFOs tested in 2025 were off-specification for at least one test parameter. In terms of regional HSFO off-specifications, South America accounted for 24% of off-specs, compared to 32% in 2024. Second highest off-spec region was Europe, with 14% in 2025 compared to 21% in 2024 and North America was third with 7% of HSFO off-specs in 2025, compared to 12% in 2024.
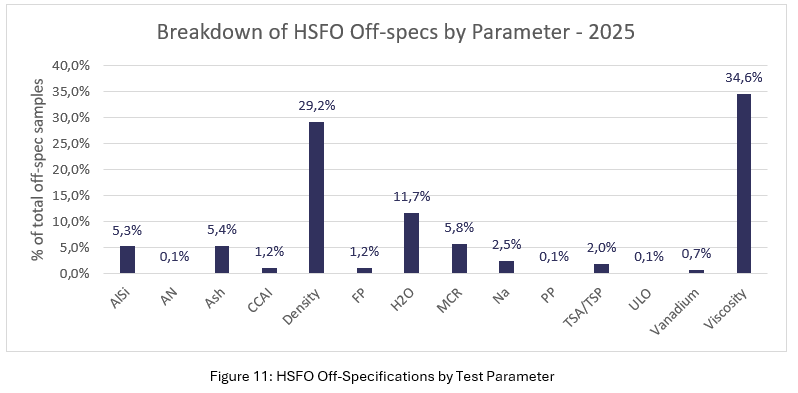
As usual, viscosity and density were the two most common HSFO off-spec parameters in 2025, with 35% of the off-spec attributed to viscosity and 29% to density, compared to 54% and 21% respectively in 2024. Water was the third most frequent HSFO off-specification parameter in 2025, with 12% off-spec level compared to 13% in 2024.
Whilst cat-fines accounted for 5.3% of HSFO off-specs in 2025, this was higher than the 2024 level of 3%. Again, like VLSFOs it highlights the importance of Fuel System Checks (FSC) to protect the engine from potential damage from this abrasive contaminant, by improving purifier efficiency. 14.5% of HSFOs had a cat-fine level of >40ppm in 2025.
MGO Fuel Quality
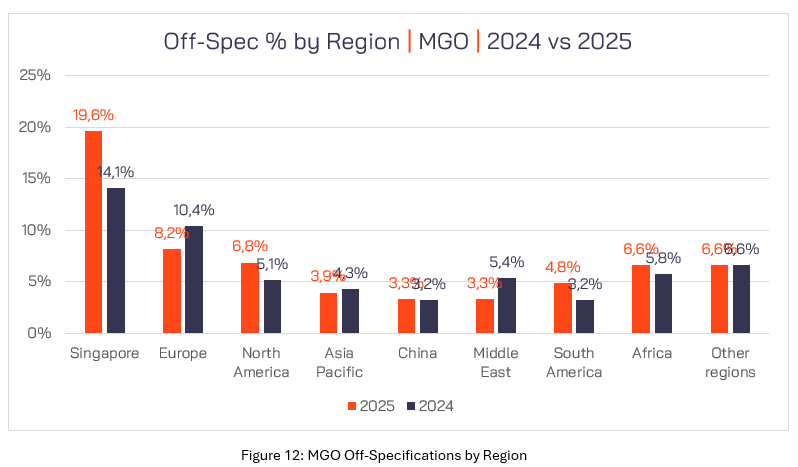
MGO accounts for 14% of all samples received by VPS for testing. Many ship owners and operators choose not to test MGO, believing this fuel type is problem-free. However, this could not be further from the truth. In 2025, 7.9% of all MGO samples tested were off-specification for at least one test parameter. Singapore accounted for 19.6% of all MGO off-specifications, which was an increase on the 14.1% Singapore experienced in 2024. Europe was the next highest region in terms of MGO off-specs with 8.2%, followed by North America showing 6.8% of all MGO off-specifications.
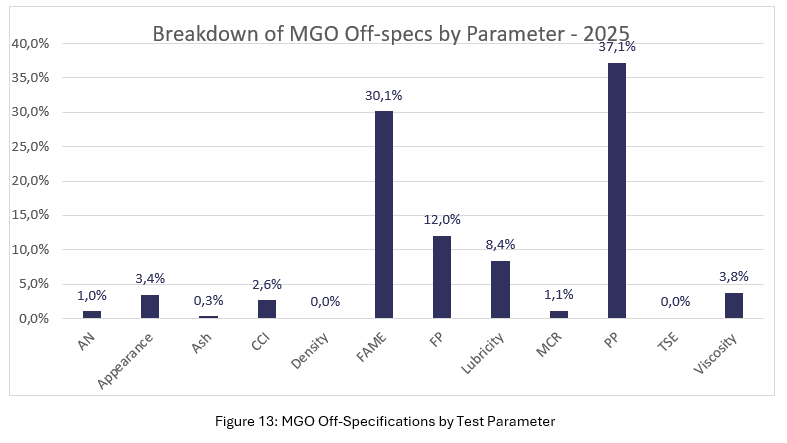
Pour Point was the most common MGO off-specification parameter in 2025, with 37% of MGO off-specs attributed to Pour Point compared to 47% in 2024. FAME contamination was the second most common MGO off-specification parameter accounting for 30.1% of all MGO off-specs. As FAME is a common component within automotive, aviation fuels and now marine biofuels, it is not surprising we are seeing such levels of off-specification.
Flash Point was the third most common MGO off-specification parameter, with 12% of MGO off-specs attributed to Flash Point.
Mediterranean ECA
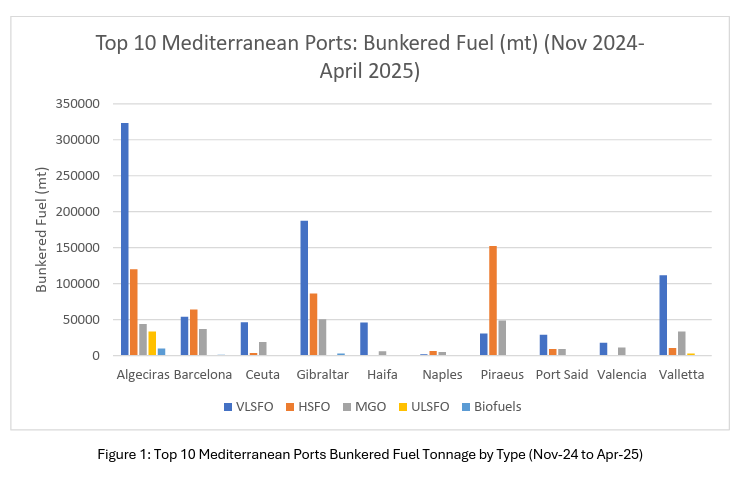
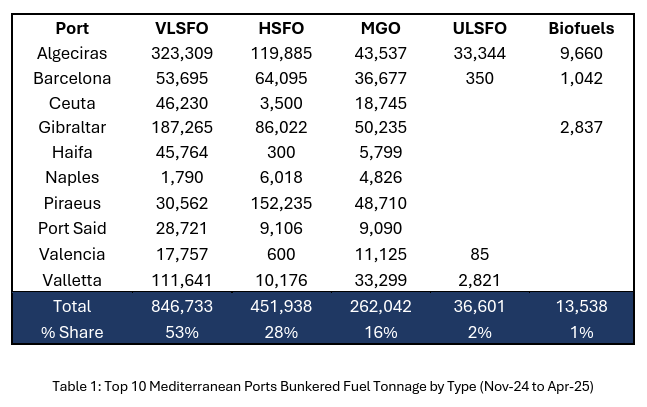
The Mediterranean ECA came into force on 1st May 2025. For the six months leading up to the implementation of the Mediterranean ECA and the six months after, the following ports provided 90% of all fuel within the region (fuel volumes in mt):
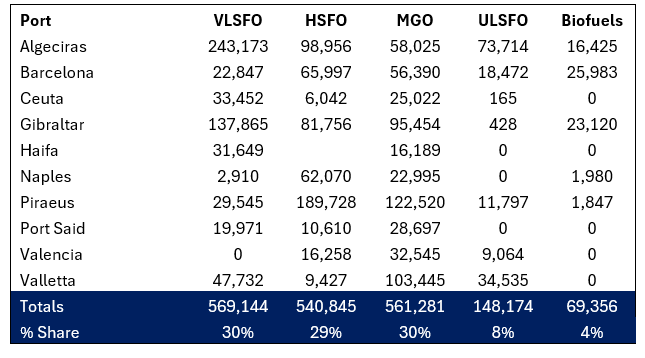
From these Top 10 Mediterranean Ports, VPS tested marine fuels representing 1.9million mt from the new ECA region compared with 1.6million mt in the six months leading up to the ECA implementation, showing an almost 20% increase in fuel supply.
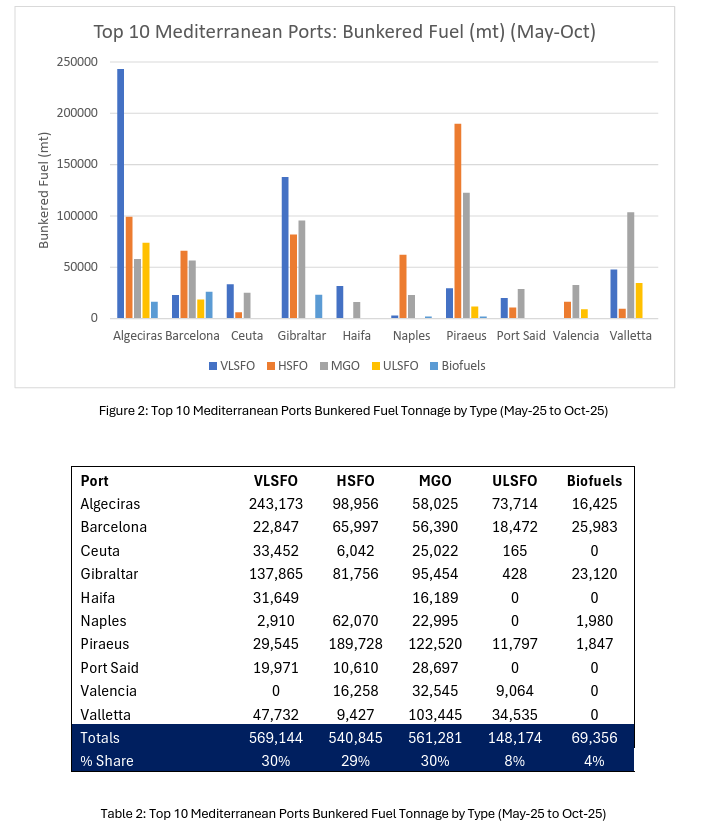
Pre-ECA implementation the fuel mix in the Mediterranean was, 53% VLSFO, 28% HSFO, 16% MGO, 2% ULSFO and 1% Biofuels. From the 1st May 2025, the mix changed to, 30% VLSFO, 29% HSFO, 30% MGO, 8% ULSFO and 4% Biofuels.
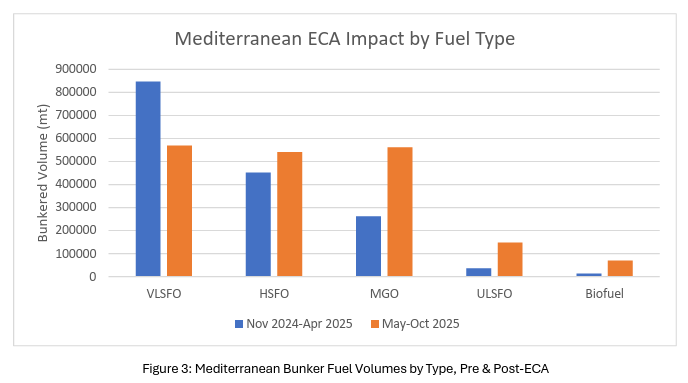
So, in terms of actual tonnage, following the implementation of the ECA, VLSFO decreased by 23%, whilst MGO usage increased by 107%. ULSFO supply increased 4-fold and biofuels increased 5-fold.
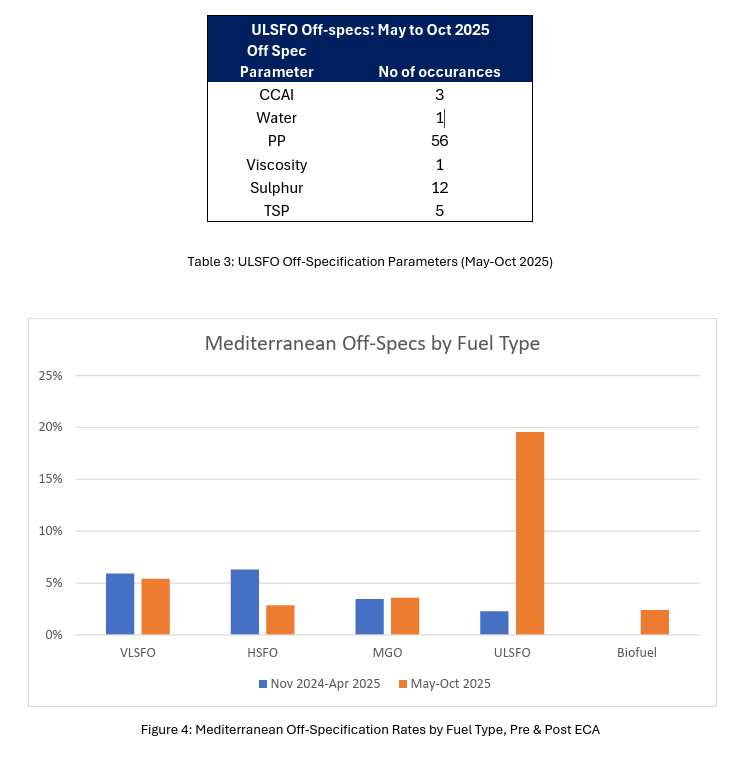
Overall Off-specification rates for all fuels before ECA implementation was 5.5% and over the first six month from the start of the ECA, the rate was 5.1%. Since the ECA implementation, off-specification rates for VLSFO and HSFO have reduced to 5% and 3% respectively. However, MGO off-specification rates have increased to 4%. However, the most worrying off-specification rates are for ULSFO which showed a 10-times increase from 2% to 20% since the start of the ECA, with the main off-specification parameters for ULSFO being pour point, sulphur, TSP, CCAI, water and viscosity.
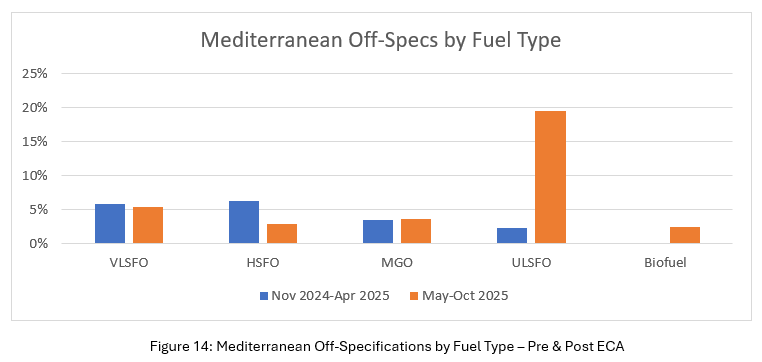
So, as anticipated, the implementation of the Mediterranean ECA on 1st May 2025, saw a significant change in the Mediterranean fuel mix, with a significant reduction in VLSFO supply and demand, but a major increase in the supply and demand of MGO, ULSFO and Biofuels. A 20% increase in HSFO supply, would indicate an increase in scrubber-fitted vessels and/or existing scrubber-fitted vessels taking more HSFO fuel.
The wide range of off-specifications across the fuel mix, continues to highlight the need for proactive fuel testing to protect the vessel, their crew and the environment. The ultimate outcome, being a successful reduction in SOx, NOx, PM and GHG emissions across the Mediterranean Sea.
Biofuels
As global shipping looks towards low-to-zero carbon fuels to answer many emissions reduction challenges, biofuels offer an immediate “drop-in” solution. As such VPS tested the equivalent of approximately 1.2 million mt of biofuels in 2025 compared to 800,000 mt in 2024.
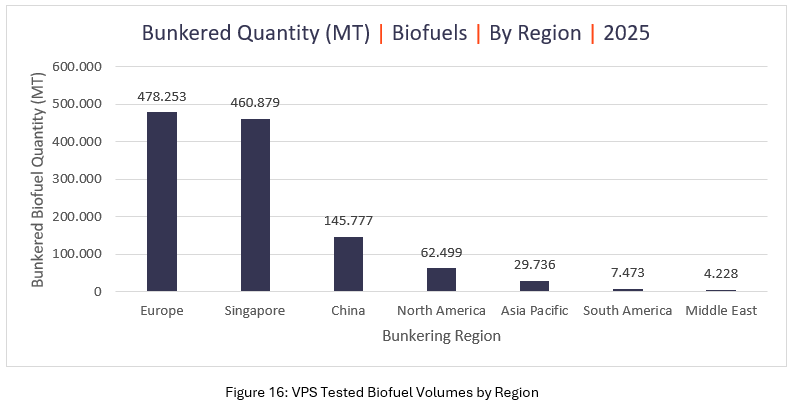
Europe, (mainly ARA-region) continued to provide the highest volume of biofuels at 478K mt (ca. 40%), but Singapore is pushing hard for the leading biofuel supply port (ca. 39%), providing 461K mt. China is significantly increasing its biofuel supplies, now accounting for 12% of biofuel supply in 2025.
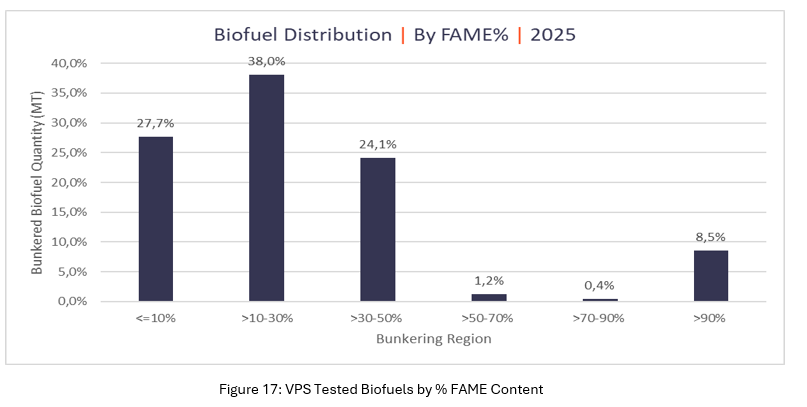
The most common biofuel blend was B30 (11-30% bio), which accounted for 38% of biofuel samples tested by VPS a decrease from 51% in 2023. Yet, there was minimal change regarding B100 demand which remained at 8%. However, the significant change was seen at the B10 blends which increased from 16% in 2024 to nearly 28% in 2025.
The majority of biofuels continue to contain mainly Fatty Acid Methyl Esters (FAME) as the bio-component, although VPS continue to receive samples containing HVO, HEFA, Cashew Nut Shell Liquid (CNSL) and Tyre Pyrolysis Oil (TPO).
Where FAME is the bio-component within marine biofuels, the key fuel management considerations are:
- Energy Content,
- Renewable Content,
- Fuel Stability,
- Cold-Flow Properties,
- Corrosivity,
- Microbial Growth
The market will continue to increase the volumes and availability of biofuels over the coming years. Whilst ISO8217:2024 now contains two test specification tables for bio-distillates and bio-residual fuels through Table 1 and Table 3, these tables do not provide full protection or detailed information regarding biofuels. Therefore, the VPS Additional Protection Service (APS-Bio) for vessels using biofuels, will continue to offer a more comprehensive test slate to VPS customers.
One point to note in relation to CNSL, is that over the past year, a number of CNSL producers, have been improving their manufacturing processes, utilising additional distillation. This converts more of the anacardic acid and cardol to cardanol, resulting in a far less acidic and reactive product, more suited to marine fuel blending.
Fuel Contamination Issues
Each year, VPS identifies a number of cases of chemical contamination of marine fuel. The majority are related to volatile organic compounds, where the most common are styrene, dicyclopentadiene and chlorinated hydrocarbons. On an individual vessel basis, such contamination can be a significant operational concern, with potentially expensive damages. On occasion, eg Houston (2018) and Singapore (2022), a more widespread contamination case is seen, which affects numerous vessels over a short-time period.
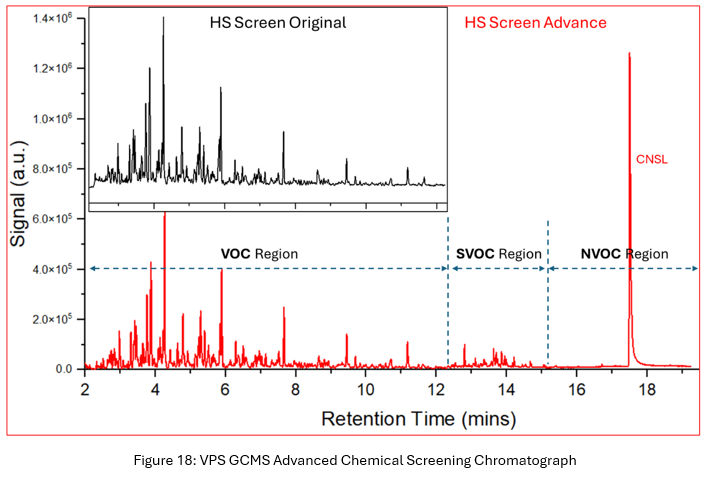
From the final quarter of 2024 and throughout 2025, VPS identified contamination of residual-based, fossil fuels with the non-volatile organic bio-component, Cashew Nut Shell Liquid (CNSL). CNSL, comprises of Anacardic Acid, Cardol and Cardanol in varying concentrations, depending upon the treatment and refining processes of the CNSL. Such contamination incidences, if not detected pre-burn, can cause numerous potential problems onboard, such as, fuel pump issues, exhaust system problems and even SCR unit failures.
To counter this, VPS developed a new, unique, pre-burn chemical screening method, which allows the detection of volatile, semi-volatile and non-volatile organic compounds in one single 20-minute analysis time. This new screening method can be used in place of the original VPS screening method, which detected only volatile organic compounds.
Methanol & Ethanol
Methanol and now ethanol are being seriously considered as low-carbon marine fuels. At the end of 2024, a new standard was introduced, ISO6583:2024 as the first international quality standard for methanol use as a marine fuel. It is very important to note, that to achieve near-zero well-to-wake emissions, the methanol used must be “green” methanol.
During the latter half of 2025, VPS became involved in numerous projects in relation to ethanol use as a marine fuel. In September 2025, the Global Ethanol Association (GEA) was launched to build demand for ethanol in shipping.
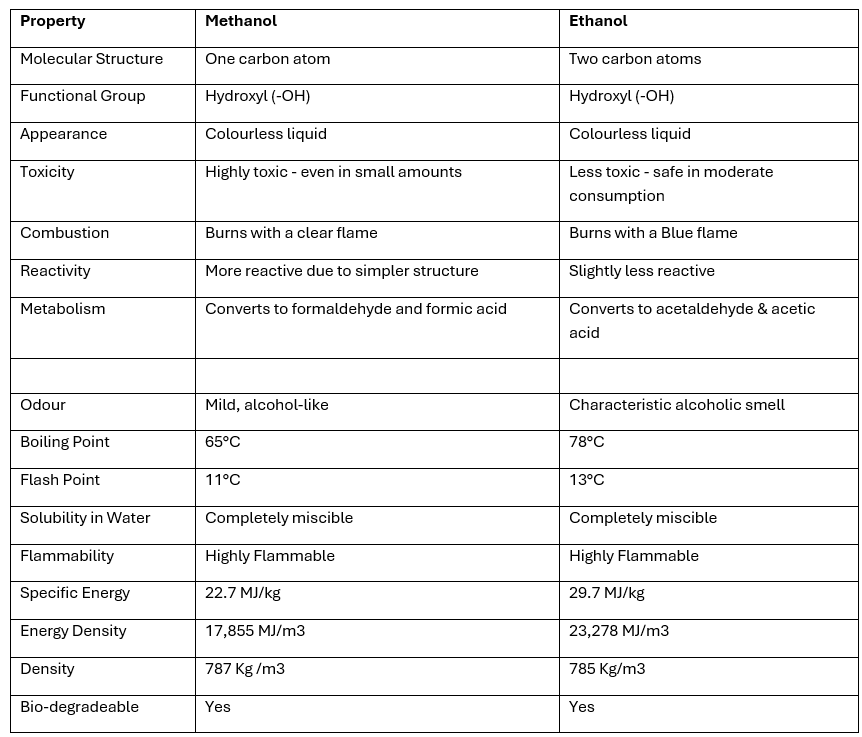
Methanol and Ethanol exhibit very similar chemical and physical characteristics and both have numerous fuel management pro’s and con’s when being considered as a marine fuel. The properties of both methanol ad ethanol are listed below for comparison:
Looking at information from the DNV AFI database and Clarksons, DNV state there are currently 450+ methanol-capable vessels in operation or on order. This includes:
• Ships already operating on methanol
• Ships capable of methanol dual‑fuel operation
• Ships under construction with methanol capability
Clarksons state methanol-capable vessels account for 14% of the alternative-fuel tonnage ordered, with methanol being the second most popular alternative fuel after LNG.
Summary
2025 once again highlighted the importance of bunker fuel quality testing, as a proactive means to protect vessels, their crew and the environment. With additional tests and services, such as Chemical Screening, Wax Appearance Temperature testing and fuel system checks (FSCs), currently not included within ISO8217, providing further vital information in achieving heightened levels of protection.
Biofuels usage, via varying blends of FAME, HVO, CNSL, etc, continue to increase in demand and importance, as ship owners and operators look to achieve improvements through CII, EEXI, as well as looking to counter the financial impact of the EU ETS scheme.
The revision of ISO8217 released on 30th May 2024, was a welcomed improvement on previous revisions, but still not a fully comprehensive solution in vessel, crew and environmental protection. Therefore, additional tests continue to hold an important role in fuel management.
Methanol and now ethanol, demand and usage will also grow, with a rapidly growing order book for dual-fuel-powered vessels. Yet, methanol and ethanol also come with a host of fuel management challenges, with testing playing a major role in ensuring quality and fit-for-purpose considerations over the coming years.
So, 2026, suggests another year of widening marine fuel types and grades coming to market, coupled with their growing fuel management considerations.
For further support to your fuel management issues, please contact steve.bee@vpsveritas.com
 Search
 Customer