All in the mix

Article published in Bunkerspot

The prospect of new fuel blends entering the bunker pool as a result of the upcoming IMO 2020 regulations has sparked a heady mixture of expectancy and concern among shipowners. Steve Bee of VPS argues that preparation and careful fuel management will be crucial in coping with the transition.

It is hard to believe it has been one year since ARACON 2018 and the highly entertaining presentation given by renowned maritime lawyer, Steve Simms of Simms Showers LLP, where he delivered an almost Monty Python-like ‘spoof’ sketch, likening marine fuel production and blending, to the ‘Three Witches cauldron scene’ from Shakespeare’s Macbeth.

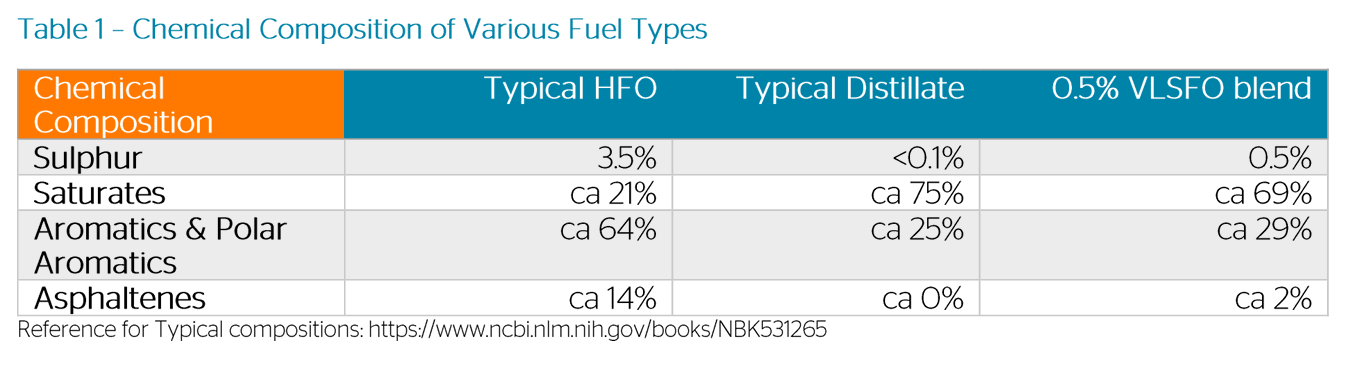
Since then, whilst we can be fairly confident no new 0.50%S-VLSFO contains ‘eye-of-newt and toe-of-frog’, it’s fair to say samples of these new fuels received and tested by Veritas Petroleum Services (VPS) so far in 2019, have shown certain characteristics which are markedly different from the traditional residual and distillate fuel-grades the industry has historically encountered. There has also been a number of new entrants to the fuel-supply market, in terms of additives, cutter stocks and ‘Compound-X’ suppliers. All of who are offering product to achieve the ‘holy grail’ of compliant fuel. As we race into and through the final quarter towards 2020, more new fuels offering compliance at <0.50%S, are coming to market. Many of these are blended products (ULS distillates + LS residues), utilising hydrotreated vacuum gas oils and hydrocracker fractionator bottoms as part of their make-up. The market’s expectations of such fuels are: increases in the number of stability issues due to heavy blending; and a greater number of compatibility issues due to the use of complex fuel blends. In addition, there are cold-flow concerns due to the presence of more wax-based components. With an expectation of larger differences between density and viscosity levels, there will be an impact on the calculated carbon aromaticity index( CCAI) and a question now over the validity of this calculation with respect to VLSFOs ignition quality? Added to this, the need for increased operational awareness due to expected elevated catfines (Al+Si) through the use of cat-cracker residues, plus lower flashpoints due to the use of inland market distillates and distillate blending. So, a significant number of expectations and concerns, but what have we actually witnessed in 2019 so far with respect to 0.50%S VLSFOs? (Table 1)

Table 1: Commercially Available 0.5% VLSFO Fuels: Test Data – VPS (Jan-Aug 2019)

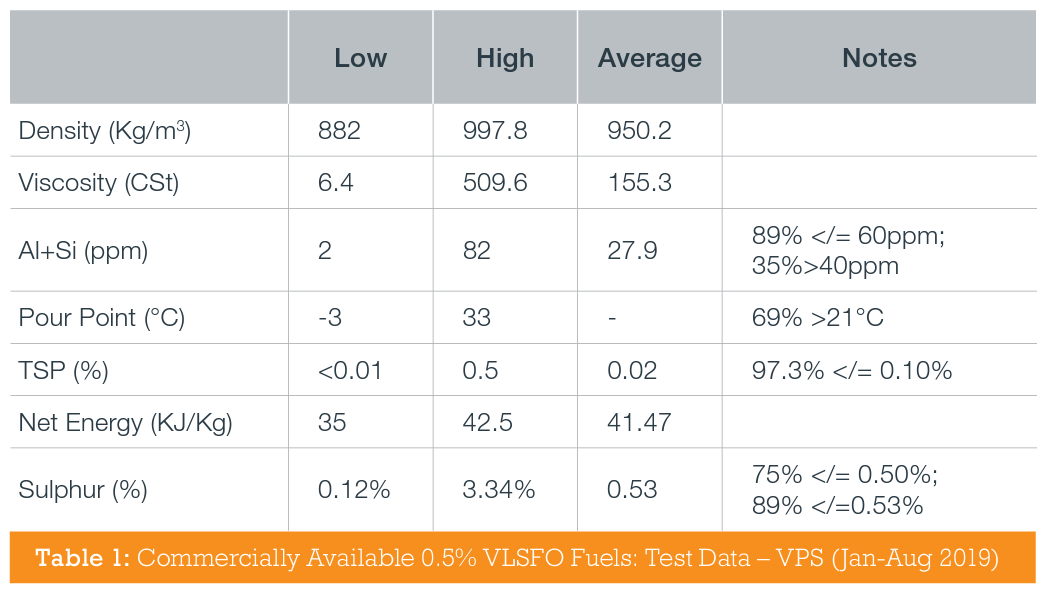
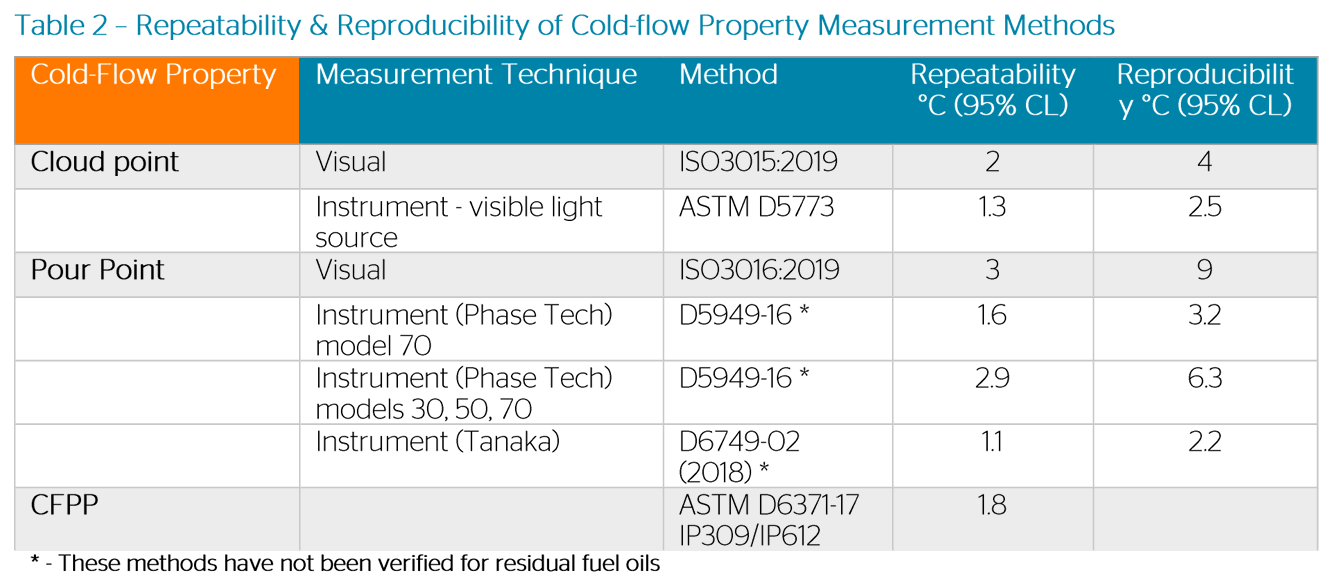
Density values of 882-998kg/m3 show an extremely wide range for the VLSFOs tested to date and one which highlights both commercial and operational implications, from fuel delivery to use. Commercial overstatement of density results in short delivery, or over payment of fuel and as such shows a benefit in undertaking bunker quantity surveys with the inclusion of density analysis. Operationally, there is a need to ensure the vessel’s separators can handle these density ranges and better still, compensate for them. VLSFO viscosities are even more wide ranging from 6.4 centiStoke (cSt) -510 cSt. It is therefore critical that a vessel’s viscosity controllers are working effectively and that the vessel has heaters capable of achieving and maintaining the required injection viscosity. Most engine manufacturers advise that the fuel’s injection viscosity should be 12-15 cSt for optimum engine performance, (Table 2). However, it’s worth noting that if a high separator temperature is required, e.g. 95°C, then lower viscosity fuels may actu-ally require cooling prior to injection. 

Pre-heat Requirements for Optimum Fuel Injection Viscosity

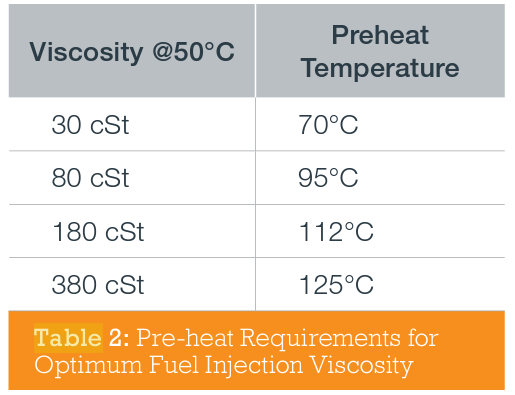
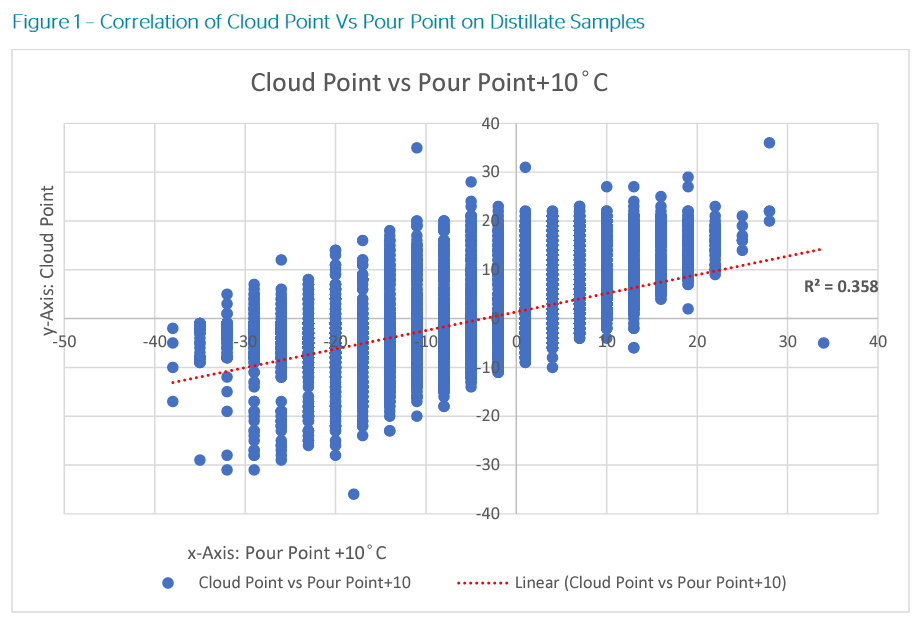
For example, a 30 cSt fuel at 95°C would result in an injection viscosity of only 8 cSt, which is below the optimum viscosity and would result in lower engine performance. As expected, densities and viscosities of VLSFOs have been found to be wide rang-ing and therefore any CCAI calculation may well be seen as meaningless with these new fuels. Fuel Combustion Analysis (FCA) testing provides much more detailed information regarding a fuel’s ignition and burn properties, such as ignition delay, combustion delays, rates of heat release and estimated cetane number, to name but a few, all of which highlight key characteristics of the specific fuel. Testing to date has shown catfine (Al+Si) levels vary greatly across VLSFOs from 2-82 parts per million (ppm). Whilst 89% of catfines tested were less or equal to the ISO8217:2017 specification limit of 60 ppm, more than one third of the fuels tested had a catfine level of >40ppm, a level VPS uses as a trigger to undertake a fuel system check (FSC). FSCs are a means of monitoring separator efficiency and performance in order to protect the engine from unnecessary damage caused by cat-fines. Almost 3% of VLSFOs tested had a Total Sediment Potential (TSP) exceeding the 0.10% ISO8217 specification limit. This is a higher number of off-specifications than we see for the more traditional residual grades of fuels, which is <1%. If we consider the concerns relating to stability and compatibility of VLSFO, then higher TSP values and certainly off-specification TSP could very well result in sludging of fuel more frequently, especially if commingling fuels. Aside from the compatibility issue, another consideration regarding commingling of fuels relates to unpumpable material, especially when moving to VLSFO use for the first time. Let’s assume a vessel has clean tanks but a small amount of unpumpable material is intended to be mixed with the first VLSFO delivery. For example, filling a 400 mt tank with a VLSFO which has 0.49%S, where the unpumpable material has 3.5%S. It would only take 6 mt of the unpumpable material to render the mix with the VLSFO in excess of the sulphur specification limit. So, how much ‘bang-for-your-buck’ do these new VLSFOs offer? VPS has seen a net energy range of 35-42.5 KJ/ Kg, but with the average at 41.5 KJ/Kg, they are in a similar range to distillate fuels, offering good energy performance. Of course, the ultimate aim for these fuels is to have a compliant sulphur content and so far, 75% of all samples tested have achieved 0.50% sulphur or below and 89% have been within the 95%-confidence limit of 0.53% sulphur. There have been a couple of samples at >3% sulphur, which is surprising! (Figure 1). However, it is worth noting that the Marine Environment Protection Committee (MEPC) 75 is expected to adopt specific criteria relating to the application of confidence limits for the sul-phur content of marine fuels. 

Sulphur content of 0.50%S VLSFOs by Region

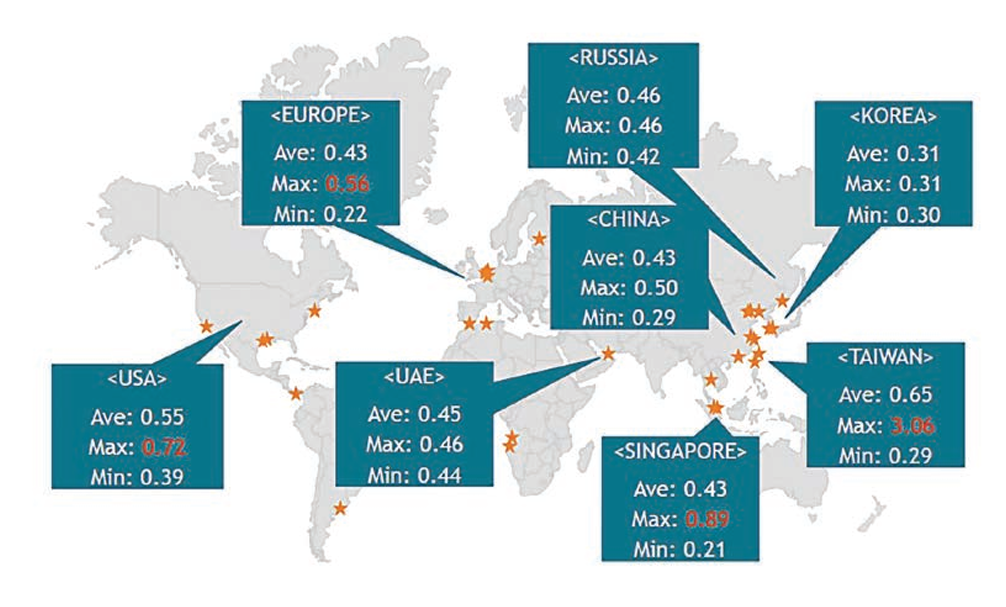
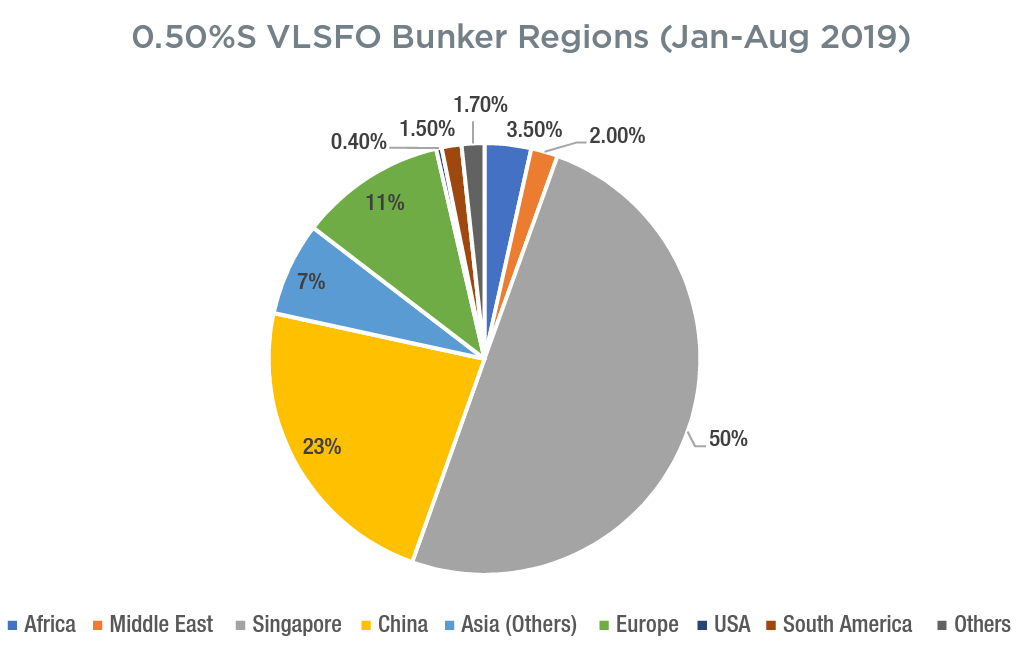
In essence, there will be three sampling points for vessel fuel: 1. MARPOL Annex VI Sample, where the 95%-confidence will not apply. The sulphur level must be at or below applicable limit (0.10%S or 0.50%S) to be considered as having met requirement, i.e. it is the ‘absolute’ limit of 0.50% for VLSFOs and it will be the supplier who is accountable for this. 2. Onboard sample and the in-use sample, where both will be allowed to apply the 95%-confidence limit, i.e. up to 0.53%S. The responsibility here lies solely with the vessel. Looking at the data regarding commercially available VLSFOs between January-August 2019, there are currently 39 ports around the globe supplying 0.50%S VLSFO products. It must be highlighted that 80% of the samples tested by VPS have come from Asian ports, mainly due to the fact China is already actively operating a 0.50%S fuel directive in its territorial waters. As we enter the final quarter of 2019, VPS fully expect to see a significant increase in 0.50%S VLSFOs samples from Europe and Americas as vessels prepare for the transition to the new global sulphur cap prior to 1 January 2020

.0.50%S VLSFO Bunker Regions

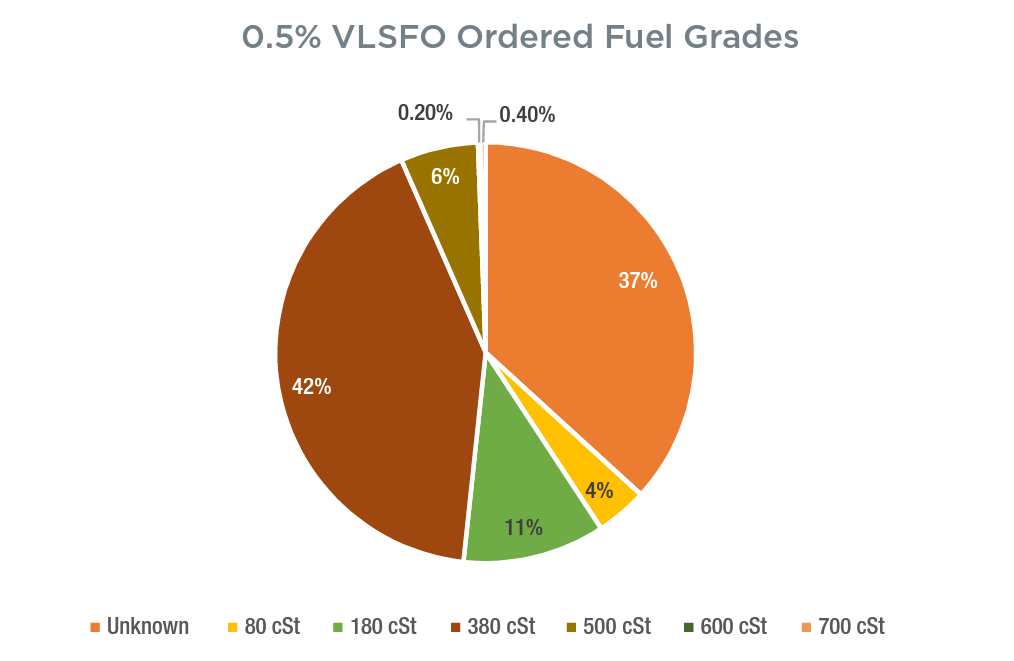
In addition, it is also worth highlighting that VLSFOs are, on numerous occasions, being ordered against specific grades (cSt) between 80-700 cSt. However, note the average viscosity is 155 cSt and the viscosity test data to date shows a wide range of 6.4-510 cSt. To date, there are more than one third of VLSFOs being ordered without a specified ‘grade’. However, as stated earlier, viscosity is a key operational parameter and any major deviations from the expected viscosity can result in poor engine performance. In conclusion, based on the 0.50%S VLSFO test data produced by VPS between January-August 2019 and feedback from shipowner/operators, these fuels are in the main, performing well, but do require additional considerations regarding stability, compatibility and catfines. Sediment and waxing are parameters which require monitoring from a storage and handling perspective, whilst regular fuel delivery system monitoring in relation to separator efficiency in particular, will assist in protecting the engine from avoidable wear and tear.

0.5% VLSFO Ordered Fuel Grades

So far, it’s safe to say that 0.50%S VLSFOs are not a ‘witches brew’, but with planned, effective fuel management, they are, in fact, good, fit-for-purpose and compliant fuels. Returning to IMO2020 and to Shakespeare’s MacBeth, ‘when the hurly burly’s done, when the battle’s lost and won’ seems to descriptively summarise the industry’s activity relating to IMO 2020 over the past few years. And when 2020 is over and we head off into this coming decade, what then for marine fuels? Well, we probably move our attentions towards the next Act, ‘Carbon-Neutral Fuels. To be continued...

An automatic test method for wax appearance temperature of VLSFO's

Article by Dr. Malcolm Cooper & Dr. Joshua Sun

Summary

Wax Appearance Temperature (WAT) or cloud point, hereinafter referred to as WAT, is the temperature at which wax crystals appear when fuel is cooled. This ultimately results in was perception causing the fuel to stop flowing, which had a detrimental; impact on operability as it may block filters and pipes, causing fuel starvation and engine problems. Proving that the fuel temperature does not fall below the WAT it will not wax, so measuring this temperature is critical in managing risk.

The measurement of the WAT of Very Low Sulphur Fuel Oils (VLSFO'S) is problematic because although various manual and instrumental methods are available, the opacity of the fuel produces unacceptable wide errors. Whilst pour point may be used as a useful cold-flow property, the definitive indicator used to identify wax precipitation is the WAT.

VPS has developed an in-house method for the measurement of WAT for VLSFO’s. The technique is based on ASTM D5773 and involves direct detection of light scattered by wax crystals using the same technology that has been used to measure the WAT of crude oil for some years. Significant work has been carried out to modify the equipment instrumentation and optimise experimental conditions for VLSFO fuel types. It is sensitive, precise and reasonably quick in delivering results. The method has been validated by correlating results of a series of distillate samples with an existing method and repeatability has been assessed on several VLSFO samples across a wide temperature range (10˚ C to 65˚ C). The WAT of many VLSFO samples bunkered over the past months has been measured and graphed. The wide variation of these results indicates the importance of measuring this parameter to mitigate cold-flow operability problems for VLSFO’S.

VLSFO Cold-Flow Problems
Compliance with the 2020 IMO 0.5% sulphur cap has driven the introduction of new 0.5% VLSFO’s produced by blending low sulphur distillates with conventional Heavy Fuel Oil (HFO). The chemical composition of these new VLSFO blended fuels is variable but strikingly different to HFO, as shown in the table of typical compositions shown below.


The increased paraffinic content (saturates) arising from the distillate composition of the new blended 0.5% VLSFO increases the likelihood of wax precipitation compared to HFO fuels. The temperature at which wax precipitation starts is dependent upon the chemical composition which varies significantly from fuel to fuel. Measurement of the temperature at which wax precipitation starts (the WAT, which is the temperature at which wax crystals appear) is important to determine the cold-flow risk of VLSFO fuels.  

Current Methods for Measurement of Cold-flow Properties
There are 3 test methods used to evaluate the cold-flow properties and likelihood of formation of wax crystals in fuel. For distillates all 3 methods can be applied as they are clear fuels, but for HFO and VLSFO’s only pour point has been applied due to the high opacity of these fuels.

Cloud Point (CP) – The temperature at which wax crystals start to form in the fuel, detected by visually seeing the fuel shift from being transparent to cloudy (ISO3015) or using instrumentation (ASTM D5773 using a light source in the visible wavelength).

Pour Point (PP) – The lowest temperature at which the fuel will continue to flow when cooled, detected visually (ISO3016) or using instrumentation (ASTM D5949, ASTM D6749-02).

Cold-filter Plugging Point (CFPP) – The lowest temperature at which a fuel of known volume continues to flow within a specified time (60 seconds) when drawn by vacuum through a standardized filter (45 micron) (ASTM D6371).


Cloud point is the definitive cold-flow property measure, since this indicates the temperature at which wax crystals start to form. The fuel will continue to flow at temperatures above the cloud point. Current test methods do not enable cloud point to be measured for opaque fuels as stated below:

ISO3015 (visual method) states that ‘it may only be used for the determination of the cloud point of petroleum products which are transparent in layers 40 mm in thickness’

ASTM D5773 (using a light source in the visible wavelength) states in the scope that ‘This test method covers the determination of the cloud point of petroleum products and biodiesel fuels that are transparent in layers 40 mm in thickness by an automatics instrument using a constant rate’

Pour point identifies the temperature at which the marine fuel ceases to flow making the fuel unusable. This is currently the only method of measuring the cold-flow properties of opaque fuels (such as HFO, as indicated in ISO8217). The visual method (ISO3016) has very poor repeatability and reproducibility whilst the automated methods (ASTM D5949-16, ASTM D6749-02) have not been verified for residual fuel oils.

A fundamental problem with the measurement of pour point to assess the risk of fuel waxing is that once the pour point is reached, the fuel has stopped flowing and started to solidify already creating problems. For this reason, the recommendation by CIMAC is to keep the fuel at 10˚ C above the pour point. However, since the definitive cold-flow property measure is cloud point (the temperature at which wax crystals form) it is useful to understand the correlations between pour point and cloud point.

Many distillate samples have been measured for both cloud point and pour point over the past few years by VPS. A graphical representation of the correlation between cloud point and pour point on distillate samples has been produced below. This data (>15,000 data points) shows a poor correlation with a measure of R2=0.358, as indicated in the graph below. This demonstrates that pour point is a poor indicator of the cloud point (i.e. wax formation temperature) of fuel. This is perhaps unsurprising since pour point is affected by additives in the fuel, whereas cloud point is not as this is a fundamental fuel property. 


The cold-flow properties of HFO are based on pour point because there are currently no methods available to measure cloud point due to opacity, and CIMAC guidance is to maintain a temperature at pour point +10˚ C to prevent problems. However, there is no correlation between pour point and cloud point as indicated in Figure 1 above. This illustrates the need for an accurate method for the measurement of cloud point in opaque fuels.

VPS Method (VPS-LP1307) for Measurement of WAT/Cloud Point of VLSFO’s
VPS has developed an in-house method for the measurement of WAT of VLSFO’s based on ASTM D5773 with instrumentation using non-visible light. Significant work has been carried out to modify the equipment instrumentation and optimise experimental conditions for VLSFO fuel types.

However, the underlying principles of this method have been applied in the measurement of wax crystal formation (WAT) in opaque crude oils in the Upstream sector for some years. This technology works on opaque oils because the light source is outside the visible spectrum. This method is used to help companies engaged in crude oil production, storage and transportation to define acceptable operational limits to prevent wax crystals forming which may restrict flow or create blockage.

The operating principle of the instrument is an optical light scattering technique which detects phase changes of crude oil with high levels of sensitivity and accuracy. The presence of wax crystals is detected in the fuel by measuring the scattering of a light source as in the diagram below. Since it is an instrumental technique the measurement is not subjective. The phase change detected is the temperature at which a crude oil sample first precipitates solid wax as it is being cooled, which is termed WAT. Similarly, the Wax Disappearance Temper (WDT) is the temperature at which the last wax solids are melted into liquid when the oil is warmed.


VPS has developed an improved method of measuring the formation of wax crystals in VLSFO’s (VPS method LP1307). Significant, work has been carried out to modify the equipment instrumentation and optimise experimental conditions for VLSFO fuel types. The method is sensitive, precise and reasonably quick in delivering results.

Validation of VPS Method (VPS-LP1307) for Measurement of WAT of VLSFO’s 
Several clear distillate blends have been tested using the new VPS method (VPS-LP1307) with instrumentation using non-visible light. These results were compared to the standard method using instrumentation with visible light. Very good correlation between the results was obtained with a measure of R2=0.98, as indicated in the graph below.

In addition to the WAT, the method provides a measurement of the WDT. This is vey useful as it is the temperature at which the last wax solids are melted into liquid when the oil is warmed. As such it provides an indication of the temperature that the fuel must be heated to in order to fully dissolve any wax solids that have precipitated. 


Repeatability of VPS Method (VPS-LP1307) for Measurement of WAT/Cloud Point of VLSFO’s
Four different fuels that had been bunkered in the ports of Singapore, Rotterdam and Houston were tested multiple times (x12) using the newly developed VPS Method (VPS-LP1307). These four different fuels each had very different WAT across the temperature range of 10˚ C to 65˚ C. The table below summarises the repeatability of these results, which shows that this method is very repeatable across the full range of temperatures.


Results of WAT and WDT Measurement of VLSFO Samples Using VPS Method (VPS-LP1307)
A number of VLSFO samples (87 in total) bunkered over the past few months across ports in Singapore, Rotterdam Houston and Fujairah have been tested using the new method. The graph below shows the spread of results. The WAT point results show a very wide range for VLSFO fuels already on the market and a number of these are elevated temperatures. This demonstrates the importance of measuring WAT for the VLSFO fuels. The WDT results indicate the temperature that these fuels would need to be heated to in order to melt all wax solids if the fuel temperature has fallen below the WAT causing waxing.


Summary 
VPS has carried out extensive research and development this new method. VPS-LP1307 for identifying the WAT on VLSFO opaque fuels. The method is sensitive, precise and has a reasonably quick analysis turnaround time. The measurement of WAT is critical in mitigating the risk of cold-flow problems when handling VLSFO fuels. Additionally, this method enables the measurement of WDT.
 

Fuel testing considerations for IMO2020

Article by Steve Bee, Group Commercial & Business Development Director

As IMO2020 draws ever closer, it is widely anticipated throughout the shipping industry that due to the increased range of new fuel types, cutter stocks and additives, coming to the market during 2019 and beyond, the demand for laboratory testing will inevitably increase.

However, as such demand increases, the availability of a laboratory to test fuel is simply not enough. The quality of testing and the management of the laboratory’s quality system to provide traceable, reliable and accurate results, has never been so important.

ISO17025, is recognised as the “Gold Medal” accreditation standard for laboratories testing marine fuel. This quality management system is extremely thorough in ensuring high standards are maintained within the laboratory on a daily basis. On an annual basis the laboratory will undergo both a management system and technical audit by a recognised independent Accreditation Body, for each of those individual tests to which the laboratory has achieved ISO17025 accreditation.

Veritas Petroleum Services, (VPS) has four fully-owned laboratories. VPS is unique in being the only dedicated marine fuel testing company, with ISO17025 accreditation for every single ISO8217 test parameter, in every one of the company’s four laboratories. Also, within VPS laboratories, bespoke tests which are outside of the ISO8217 specification are still validated, checked and performed according to the requirements of ISO17025.

ISO17025 insists on full traceability of the testing of every single sample for every single test undertaken. This ensures the provision of a data-trail of a sample’s journey through the laboratory, with a record of each and every person who comes into contact with the sample, from receipt, to booking-in, to each chemist carrying out specific tests, the results and their reporting. The instrumentation and equipment used, also undergoes daily quality checks, being monitored continuously to ensure optimum accurate performance, along with the routine maintenance of such equipment. A key feature is the monitoring of the capabilities of laboratory chemists and analysts which are tracked via training records, to ensure only qualified, trained and experienced staff handle certain laboratory procedures. In addition, all methods and procedures are controlled documents and all software systems, such as Laboratory Information Management Systems (LIMS) are checked for accuracy and reliability. Finally, a full continuous improvement programme, with root-cause analysis and corrective actions, must be in place and employed.

A laboratory following all the above, will provide peace-of-mind, in the quality, accuracy and reliability of its testing, reporting and advice to ship owners and operators. In addition, it has been recognised that fuel quality and the imminent arrival of a wider range of fuel types to the market, with the potential for varying cutter stocks, blending agents, diluents and additives to enter the supply-chain, will potentially cause additional fuel-quality concerns.

VPS would always advise clients to endeavour to buy fuel and test to the latest revision of ISO8217, but as no new revision is expected until post-2020, additional testing will provide enhanced protection of the vessel and its operations.

Compatibility and Stability are two key concerns to the vessel and its chief engineer and testing, such as blend compatibility and hot-filtration methods TSP, TSA and TSE, all increase in importance in the information they can provide, regarding co-mingling issues and the potential for sediment to form from a fuel. Complimentary to the hot-filtration methods is Separability Number (Reserve Stability Number, RSN), which will predict the likelihood of asphaltenic drop-out from a fuel and sludge formation.

2018 highlighted a key need to employ laboratory test methods to identify the presence of chemical contamination of fuels. Such chemicals may have been unknowingly present, others may have been present due to adulteration of the fuel. Either way, high-end forensic techniques such as GasChromatography Mass-Spectrometry (GCMS) and Fourier Transform Infrared (FTIR), were key in analysing and detecting such species within the fuels.

With GCMS, it is important to recognise the preparation of the sample, prior to GCMS will determine what is identified and found within the fuel. Head-Space GCMS is employed by VPS, firstly as a chemical screening method for the rapid detection of volatile chemicals. The screen can be followed by an extended head-space analysis for more specific determination. This may account for up to 70% of all chemical contaminants potentially found within fuel. VPS have GCMS-HS capability in all four of its labs, via seven instruments. This allows rapid turn-around of sample analysis within 24-hours and reporting with the other ISO8217 tests.

Other sample preparation techniques such as Acid Extraction and Vacuum-distillation, allow GCMS to identify specific components, based upon their chemistry. For example, Acid Extraction will qualitatively or quantitatively detect the presence of acids and phenols within fuel. It is worth noting, that these GCMS methods are proprietary “in-house” methods, with their development based upon VPS’ experience and expertise in almost 40 years of fuel testing.

Since 1st January 2015, VPS has witnessed a significant increase in distillate sample receipt, coupled with increasing distillate quality issues, due to market demand and consequently higher levels of distillate treatment and blending. Market demand for distillates will increase from 2020 and as such a further increase in quality issues. The monitoring and analysis of distillates is therefore extremely important and increasing in demand. Once again, the additional tests further to ISO8217 required for distillates are available from all four VPS laboratories and include cold-filter plugging point and cloud point as part of the cold-flow properties tested, in order to avoid fuel-waxing. FTIR testing to identify bio/FAME presence and the potential issues such components can cause, such as fuel instability, oxidation, metal erosion, seal deterioration and an affinity to absorb water. Bacterial testing to avoid bug-growth within fuel tanks, piping and filters, avoiding the associated operational issues and potential corrosion, is also key and such monitoring should improve on-board housekeeping.  

Having the capacity to provide ISO17025 accredited, ISO8217 testing, plus all the highlighted additional tests from all four laboratories allows VPS to deliver not only accurate, reliable and comprehensive test information, but with a fast turn-around of testing and reporting. All of which will be key to ship owners and operators and the challenges they face as the industry heads into the complex world of fuel usage and management.

OCM - Water contamination in a marine lubricant environment

Article by Paul Parkinson - Global OCM Business Development Leader

Water is known the world over as a key substance to life on earth. Put simply, the life of our planet and all living things residing upon and within it, are highly dependent upon water. Yet in the world of engines, machinery and lubricants, the total opposite applies where water can lead to the death of mechanical assets, or at least their failure to operate, or the lubricant to be effective.

This article aims to explain;

• Problems associated with water in a marine vessel lubrication environment,  

• The use of Oil Condition Monitoring (OCM) as an effective means of identification and quantification  

• The different types of OCM tests for water available and

• Prevention and Potential solutions  

Where does water contamination come from?

It is easy to see the potential for seawater ingress in a maritime environment. However, fresh water can also present a problem, entering via condensation or leakage from cooling or heating systems. Water (either fresh or saline) can exist in any one of three forms; dissolved, emulsified or separated.

What problems are associated with water contamination in lubricating oil?

Even at low concentrations (0.1-0.2%) water can compromise the purpose and effectiveness of lubricants. Lubricating oils have a vital part to play in the marine world and industry in general as they are designed to reduce friction and wear, cool parts, form seals, as well as absorb shock loads, dampen noise, transport energy and act as cleaning agents.

CIMAC (the International Council on Combustion Engines) states in its Publication 30 Used Oil Engine Analysis – User Interpretation Guide, “Water affects the viscosity and lubricity of the lubricating oil and if not removed it may form an emulsion.” Noria Corporation (Lubrication and Oil Analysis Training Organisation) in their “Best ways to test water in oil” tell us that “bearing life can be reduced to less than 25%, if water is present in quantities as low as 1000ppm (0.1%).”  

Water can cause the formation of acids, sludge and varnish, leading to corrosion (rust) and damage to bearings and other engine parts. Furthermore microbes can flourish in the presence of water leading to corrosion in storage tanks and pipes and potentially blocked filters.

How do we monitor for water presence?

Oil Condition Monitoring (OCM) utilises the science of tribology and monitors the condition of both lubricant and machinery and has an important role in preventive maintenance programmes. The best analogy is that of a blood sample taken by your doctor to identify, predict and help combat  any potential health issues. Water analysis in oil is considered one of the most important OCM tests to perform.

Like any testing programme, taking the sample is a key and fundamental part of the monitoring process. It is important therefore that the contents of any sampling kit used, are easy to use and practical. A representative sample taken in the correct fashion with the appropriate container is vital to receiving a meaningful result. Using a container which has been used previously, will more than likely affect the analysis, challenging the integrity of the analysis and any resulting advice.  

Information relating to the sampling location, type of lubricant and operating hours, are key and must be recorded to facilitate a comprehensive report. Furthermore the initial sampling stage is also very helpful in terms of identifying a potential problem as the sampler will be able to see if water is present through the lubricant exhibiting a milky or cloudy appearance.  

What are the best laboratory tests for water?

On-board sampling kits are a convenient initial solution but, given the low levels of detection required, they certainly have their limitations. Water does not always emulsify and it can dissolve in low concentrations, where such levels would be below the limit of detection of such portable kits. A more sensitive and sophisticated analytical laboratory solution should always be considered in order to confidently establish the presence of low levels of water. Further to this there are a number of analytical procedures available and each employs a different technique. It is important to understand the limitations of each technique before acting upon a value. The different tests available are summarised in Table 1. 


In summary, crackle and FT-IR methods are useful screen techniques but should be used with caution given their respective technical frailties. It is regarded by many that the best procedure from an analytical perspective is the Karl Fischer (KF) reaction which is selective to water and is able to measure all three forms. The Coulometric technique is more sensitive than the volumetric one. The volumetric technique is reliable at points of a percent level, yet coulometric KF can detect water down to low ppm levels. The additional distillation step provided through ASTM D6304 C (using an oven accessory) gives even greater reliability as it avoids additive interferences and it is only the water that is evaporated and eventually measured. Detection levels can be down to as low as 50ppm.  


It is worth noting that the temptation to use the crackle test can create a multitude of problems. This test centres on water crackling (spitting) when in contact with a hot surface. It is simple, inexpensive and fast, so satisfies certain important criteria. Unfortunately, it is also very subjective, only responds to free water and is affected by additives that may be present.  

Any other issues around water testing and reporting that we should be aware of?

Industry standard (e.g. ASTM) test procedures will expect results (as %) to be reported to a given number of decimal places. For ASTM D6304 C this is two decimal places. This could lead to potential rounding errors, that being the difference between the actual value and the rounded up value.

There are also two important scientific definitions that need to be explained. In an ideal world if a specified test procedure is performed by any lab, all results would be identical. The reality is somewhat different and “acceptable imperfections” are defined by the American Society for Testing and Materials (ASTM) as Repeatability (r) and Reproducibility (R) for each of their methods. Repeatability describes the range that an obtained result differs or may differ from the true value if the analysis is performed on the same date by the same test method and equipment on the same test material, by the same analyst. Reproducibility describes the range that an obtained result differs or may differ from the true value if the analysis is performed on the same test material by the same test method, but under different circumstances, ie different laboratory, different equipment and different analyst. Obviously, different circumstances cause greater variation in the results, and therefore, the reproducibility range will be wider than the repeatability.

What does Rounding, Repeatability and Reproducibility mean for Water Content and testing in general?

As a general guide VPS use 0.2% water in 2 stroke/ 4 stroke engines as a warning level while hydraulic systems and gearbox are triggered at 0.1%. Results above these values are considered to be critical and action should be taken immediately. Engine manufacturers state similar values; MAN B&W criteria for cleaning / exchanging of lubricating oil is  0.2 % (max 0.5% for a short limit), MAK says 0.2 %  and  Wartsila states 0.3 % as a “condemning” limit.

This means that a two decimal result (from ASTM D6304C) when rounded to one could trigger a stated limit. Furthermore because of the repeatability and reproducibility effects a result should not always be seen as a single figure when comparing with a guideline (or data from another lab) but needs to be understood as within a calculated range of the value provided.  

This may seems a complex situation and to help unravel the potential confusion and difficulties around these three R’s, you should always consult with your OCM supplier. VPS provide this support from our in-house experienced laboratory personnel and our technical advisers/diagnosticians.

What can be done to prevent or minimise water presence?

Unfortunately, it is almost inevitable that there will be an ingress of water. It is important once identified that you perform a root cause analysis to establish its source and put any available measures in place to prevent or limit water ingress. In an engineering sense, centrifugation before separation or desiccant breather systems (if appropriate) will help minimise water ingress. Regular checking of seals will always be advantageous. These in addition to good hygiene are good, logical and sensible preventative approaches. Furthermore, lubricant companies include specific additive chemical compounds to combat water and enhance the base oil. Demulsifier additives are focussed on stopping the formation of an oil water emulsion, allowing free water to be more easily identified and dealt with. Biocides can also be added to prevent any damaging microbial activity. Whatever measures are used there will always be potential for water contamination in a marine environment. It is important that a predictive maintenance programme is in place to minimise the length of time of its existence to reduce the amount of damage as illustrated in chart 1. This chart shows that no intervention in terms of cost and risk is not a viable or sensible option. The US Department of Energy Federal Energy Management Program (FEMP) has estimated that a properly functioning Predictive Maintenance programme can provide between 30%-40% savings over a reactive maintenance programme and can;  

• Reduce maintenance costs by 25-30%

• Eliminate breakdowns by 70-75%


In conclusion, we should recognise the importance and value of oil condition monitoring and balance its relatively small cost against the enormous saving on replacement, repair or downtime. The benefits and savings of OCM are further enhanced when considering the significant changes to fuel and abatement technologies that will occur as a consequence of the 2020 legislation. Veritas Petroleum Services (www.v-p-s.com) are completely independent and impartial and are an international market leader in fuel and oil testing, inspection and advisory services. VPS has an important role in OCM and Fuel Testing preventive maintenance programs and our Rotterdam Laboratory has the very latest analytical technology, automation and robotics for the testing of lubricants and fuels. 

TRANSFORMER OIL TESTING BROCHURE

Transformer Oil Testing Brochure